Image Details
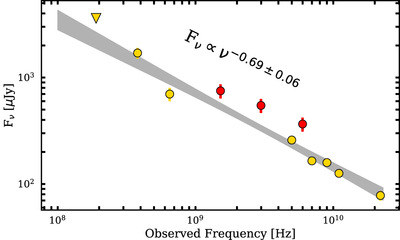
Caption: Figure 5.
Radio SED at 190 MHz < ν < 22 GHz including our data (red circles), data from the uGMRT at 380 and 650 MHz, and the VLA in C- and D-configurations (yellow circles; Piro et al. 2021; Wharton et al. 2021). The gray shaded region corresponds to the best-fit power law (assuming F ν ∝ν α ) to the archival data and the 1σ error region. We find a spectral index of −0.69 ± 0.06, consistent with the expectation for star formation.
Other Images in This Article

Copyright and Terms & Conditions
© 2024. The Author(s). Published by the American Astronomical Society.
Copyright ©
2025 Astronomy Image Explorer. All Rights Reserved.