Image Details
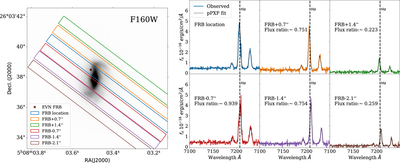
Caption: Figure 3.
Left: Slit positions of the DEIMOS observations overlaid on the HST F160W image of the host galaxy. Each slit has a width of 0.″7 although shown in this figure with 0.″6 widths for clarity. The centers of each adjacent position are spaced 0.″7 apart, thus providing full spatial coverage of the galactic disk. The blue rectangle denotes the slit position and angle aligned with the FRB position, while the remaining positions cover the rest of the galaxy. Right: Spectra from the six slit positions zoomed in on Hα. The six pointings are ordered and color-coded as in the left panel. Pointings are labeled by their offsets perpendicular to the initial slit position. We fit the spectra using the pPXF routine and overlaid the best fit as the solid black curves. The vertical dashed lines show the expected location of Hα based on the galaxy redshift. The flux ratio in each panel corresponds to the pPXF estimates of the Hα flux values with respect to the blue pointing, i.e., the flux ratio of the blue pointing is 1. We find no enhancement in the flux ratio through the blue pointing that contains the FRB location.
Other Images in This Article

Copyright and Terms & Conditions
© 2024. The Author(s). Published by the American Astronomical Society.