Image Details
Caption: Figure 3.
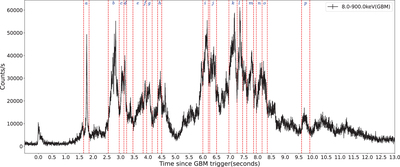
Light curve of the hard main emission of GRB 211211A (black curve) and the time slices, marked with two red vertical dashed lines and labels “a”–“p”, for our spectral analysis.
Other Images in This Article
Copyright and Terms & Conditions
© 2023. The Author(s). Published by the American Astronomical Society.
Copyright ©
2025 Astronomy Image Explorer. All Rights Reserved.