Image Details
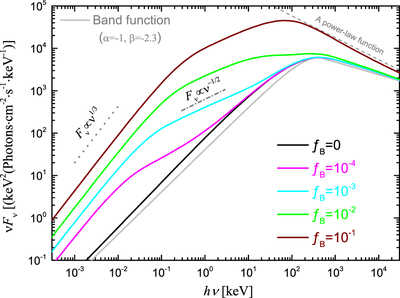
Caption: Figure 1.
Radiation spectra of our model with different f B, i.e., f B = 0 (black), 10−4 (magenta), 10−3 (cyan), 10−2 (green), and 10−1 (wine), where L obs = 1052erg s−1, R dis = 1015 cm, p = 3.5, α B = 1, ﹩{\gamma }_{{\rm{m}}}^{{\prime} }=3\times {10}^{3}﹩, and z = 1 are taken. In this figure, the Band radiation spectrum with E p = 400 keV, α = −1, and β = −2.3 (gray solid line) and the power-law spectra with spectral index ﹩\hat{{\rm{\Gamma }}}=1/3﹩ (gray dotted line) or ﹩\hat{{\rm{\Gamma }}}=-1/2﹩ (gray dashed–dotted line) are also shown for comparison.
Other Images in This Article
Copyright and Terms & Conditions
© 2023. The Author(s). Published by the American Astronomical Society.