Image Details
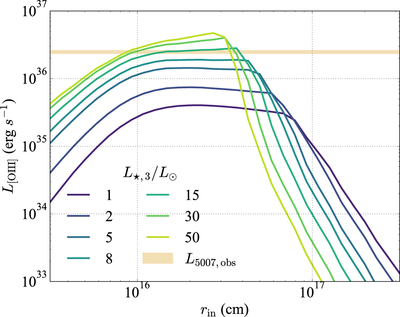
Caption: Figure 1.
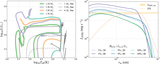
L [O III] from CLOUDY simulations as a function of cloud inner radii at a range of central stellar luminosity. The dust-to-gas mass ratio is assumed to be 1% in this case. The peak line luminosity occurs at similar radii, and is used to produce Figure 3 at different ejecta masses. The orange-shaded region reflects the observed PNLF bright-end cutoff at M 5007 = −4.53 ± 0.06 translated to line luminosity from Ciardullo (2012).
Other Images in This Article
Copyright and Terms & Conditions
© 2023. The Author(s). Published by the American Astronomical Society.
Copyright ©
2025 Astronomy Image Explorer. All Rights Reserved.