Image Details
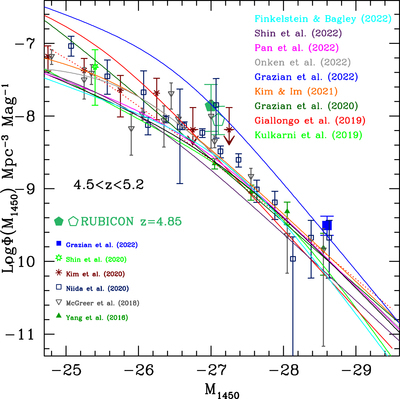
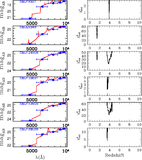
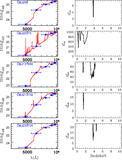
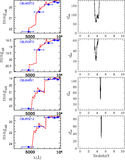
Caption: Figure 6.
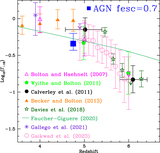
The QSO luminosity function at z ∼ 5 from the HSC-Udeep and HSC-Wide surveys. The filled green pentagon shows the space density of z ∼ 5 QSOs in the HSC-Udeep area, while the open green pentagon shows the space density in the HSC-Wide area, considering only confirmed QSOs with available spectroscopic redshifts. These values are a factor of ∼2–3 larger than previous determinations available in the literature, highlighted by small symbols. The magenta line is model 4 of Pan et al. (2022).
Other Images in This Article
Copyright and Terms & Conditions
© 2023. The Author(s). Published by the American Astronomical Society.
Copyright ©
2025 Astronomy Image Explorer. All Rights Reserved.