Image Details
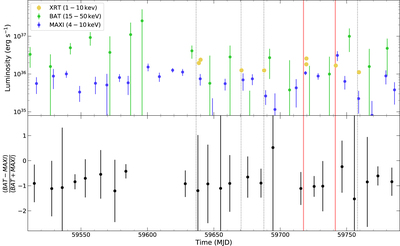
Caption: Figure 2.
Top: X-ray light curves for MAXI (4–10 keV; blue) and Swift/BAT (15–50 keV; green) for times surrounding our 2022 VLA data. MAXI data points are binned to 10 days while BAT data are binned to 15 days. Also plotted are the Swift/XRT measurements (1–10 keV; yellow). Dashed vertical gray lines indicate non-detections in our simultaneous VLA observations; the solid vertical red line represents radio detections. Bottom: Hardness ratio light curve for data in top panel.
Other Images in This Article
Copyright and Terms & Conditions
© 2023. The Author(s). Published by the American Astronomical Society.
Copyright ©
2026 Astronomy Image Explorer. All Rights Reserved.