Image Details
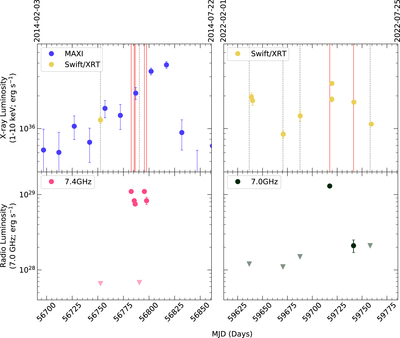
Caption: Figure 1.
2014 (left panel) and 2022 (right panel) radio and X-ray light curves for X1850–087 (see also Panurach et al. 2021). The top row shows X-ray light curves from MAXI (blue) and Swift/XRT (yellow), all plotted as 1–10 keV luminosities. The bottom row shows 7.4 (left in pink; from 2014) and 7.0 GHz (right in black; from 2022) VLA radio luminosity light curves. Filled circles represent detections while upside down triangles are 3σ upper limits. Solid salmon vertical lines in the top row represent radio detections, while gray dotted lines represent non-detections.
Other Images in This Article
Copyright and Terms & Conditions
© 2023. The Author(s). Published by the American Astronomical Society.
Copyright ©
2026 Astronomy Image Explorer. All Rights Reserved.