Image Details
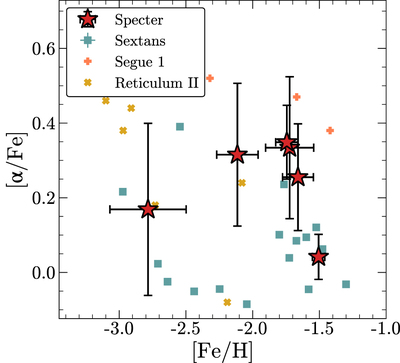
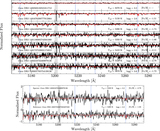
Caption: Figure 4.
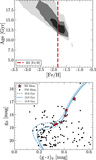
Tinsley–Wallerstein diagram of Specter members using measurements from H3, excluding the BHB star. We overlay abundance measurements for ultrafaint dwarf galaxies with similar luminosities (Frebel et al. 2014; Ji et al. 2016). We also show stars in the Sextans dwarf galaxy observed by H3, which should be on an identical metallicity scale to the Specter stars.
Other Images in This Article

Copyright and Terms & Conditions
© 2022. The Author(s). Published by the American Astronomical Society.
Copyright ©
2025 Astronomy Image Explorer. All Rights Reserved.