Image Details
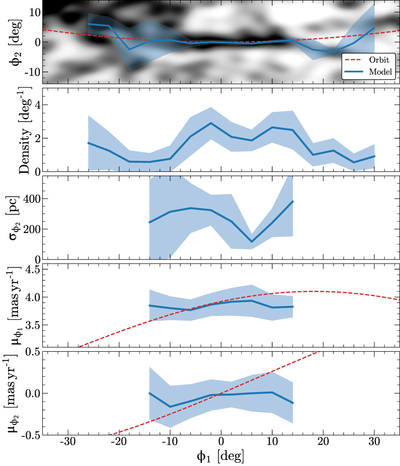
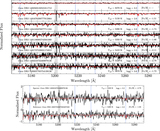
Caption: Figure 3.
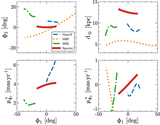
Mixture modeling the spatial structure of Specter. Top panel: Observed spatial density of stars that pass our proper motion and isochrone selection. We overlay the fitted mean ϕ 2 of the Gaussian component in each ϕ 1 bin, along with the predicted orbit of the H3 member stars. Second panel: the density of stars in the Gaussian stream component of each bin. Third panel: the standard deviation of the Gaussian component, transformed to physical units using the distance predicted by the orbit model. Fourth and bottom panels: median and standard deviation of the proper motions of stars in the Gaussian component.
Other Images in This Article

Copyright and Terms & Conditions
© 2022. The Author(s). Published by the American Astronomical Society.