Image Details
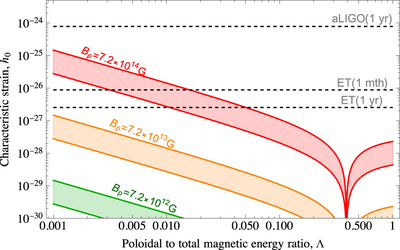
Caption: Figure 5.
Characteristic strains h 0 from Equation (20) as a function of the poloidal-to-total magnetic energy ratio, Λ, using the dipolar Tolman-VII model (Equation (21)) of Mastrano et al. (2011) for LSI. The colored bands represent the prediction for different B p , with the lower curves having M ⋆ = 1.4 M ⊙ and R ⋆ = 10 km and the upper curves having M ⋆ = 2 M ⊙ and R ⋆ = 14 km. Overlaid are the detection thresholds for aLIGO and ET for a variety of different observation times T obs, as indicated by the labeled dashed lines.
Other Images in This Article
Copyright and Terms & Conditions
© 2022. The Author(s). Published by the American Astronomical Society.