Image Details
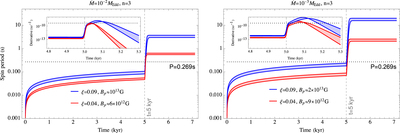
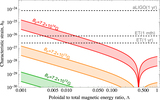
Caption: Figure 2.
“Weak-field” P(t) tracks for LSI, with assumed accretion rates of ﹩\dot{M}={10}^{-2}﹩ and ﹩{10}^{-3}{\dot{M}}_{{\rm{E}}{\rm{d}}{\rm{d}}}﹩ for t ≥ 5 kyr in the left and right panels, respectively, though with negligible propeller torques at earlier times. The blue (red) curve, whose width accounts for a fiducial uncertainty in the maximum period derivative, viz. ﹩3.2\leqslant \dot{P}/{10}^{-10}\leqslant 4.4﹩, has ξ = 0.09(0.04). We fix the (intrinsic) braking index at n = 3 and inclination angle at α = 0. The polar field strength, as shown in the panel legends, is chosen such that the torques produce the requisite ﹩\dot{P}﹩ when P = 0.269 s. The figure insets display the period derivative; the rapid rise occurs because strong propeller torques are turned on.
Other Images in This Article
Copyright and Terms & Conditions
© 2022. The Author(s). Published by the American Astronomical Society.