Image Details
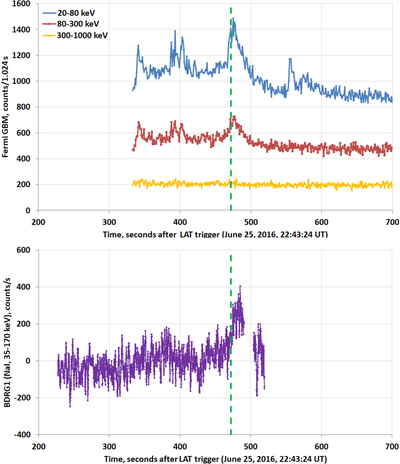
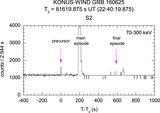
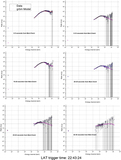
Caption: Figure 4.
The top panel represents the GBM/Fermi counting rate vs. time in the 20–80, 80–300, and 300–1000 keV energy ranges, and the bottom panel represents the light curve from the BDRG1 (NaI detector) 35–170 keV channel cleaned from electron flux background variations, i.e., the zero counts correspond to the mean background level. The green dashed line represents the GBM/Fermi trigger (22:51:16 UT).
Other Images in This Article
Show More
Copyright and Terms & Conditions
© 2023. The Author(s). Published by the American Astronomical Society.
Copyright ©
2025 Astronomy Image Explorer. All Rights Reserved.