Image Details
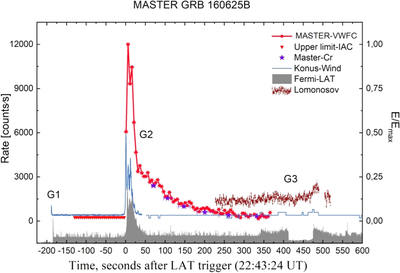
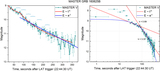
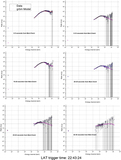
Caption: Figure 1.
The red curve represents the observations of the very wide-field MASTER-IAC cameras, reduced to the proper time of the system (compression of the burst timescale relative to the observed one). The blue asterisks correspond to the MASTER-Tavrida measurements taken at a lower temporal resolution. The gray curve corresponds to the emission detected by Fermi-LAT.
Other Images in This Article
Show More
Copyright and Terms & Conditions
© 2023. The Author(s). Published by the American Astronomical Society.
Copyright ©
2025 Astronomy Image Explorer. All Rights Reserved.