Image Details
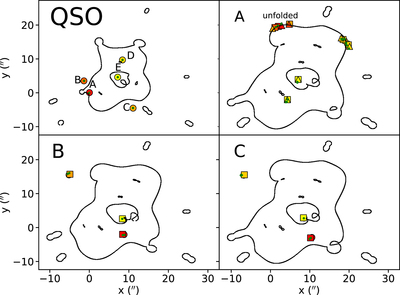
Caption: Figure 2.
Critical curves and images positions for the four background sources. The green dots mark the observed positions of the images. Circles denote the quasar, A1, B1, and C1 images, squares represent the images of A2, B2, and C2, and lastly the triangles mark the A3 images. Additionally, images are color coded depending on their flux, from the brightest in red to the dimmest in yellow.
Other Images in This Article
Copyright and Terms & Conditions
© 2022. The Author(s). Published by the American Astronomical Society.
Copyright ©
2025 Astronomy Image Explorer. All Rights Reserved.