Image Details
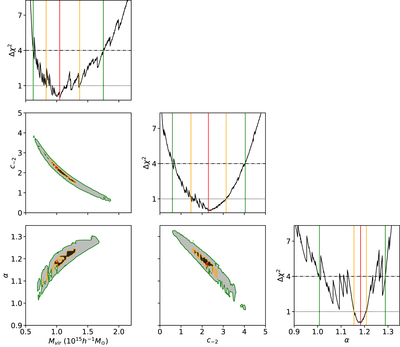
Caption: Figure 1.
χ 2 contours and profiles for the virial mass, concentration, and inner slope parameters of the generalized NFW model (Equation (1)). Red lines and points mark the values for which the χ 2 is minimized, orange lines delimiter the 1σ contours, and green lines the 2σ contours. The black (gray) shadow is the 1σ (2σ) region.
Other Images in This Article
Copyright and Terms & Conditions
© 2022. The Author(s). Published by the American Astronomical Society.
Copyright ©
2025 Astronomy Image Explorer. All Rights Reserved.