Image Details
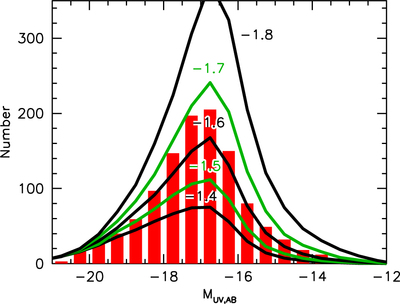
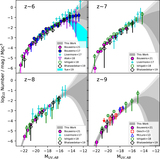
Caption: Figure 2.
Use of the lensed z ∼ 3 samples from the HFF program (red histogram) to illustrate the leverage available to constrain the faint-end slope α. The green and black lines show the predicted number of sources per bin for different values of the faint-end slope. The faint-end slope α appears to be ∼−1.65. Interestingly enough, we can use this figure to assess the faint-end slopes α derived earlier by Parsa et al. (2016) and Alavi et al. (2016), i.e., −1.31 ± 0.04 and −1.94 ± 0.06. Those results are strictly shallower and steeper, respectively, than the faint-end slopes for any of the models shown on this figure and thus appear to be inconsistent with our new results. Clearly, there is enormous leverage available in lensed HFF samples to constrain the faint-end slope very precisely (as also illustrated by the ∼2%–3% uncertainties in α presented in Table 2).
Other Images in This Article
Show More
Copyright and Terms & Conditions
© 2022. The Author(s). Published by the American Astronomical Society.