Image Details
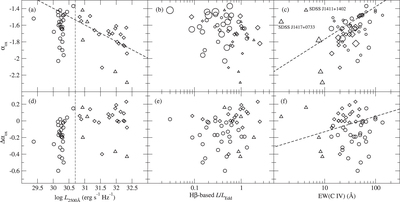
Caption: Figure 4.
Optical-to-X-ray spectral slope (α ox) (top) and Δα ox (bottom) vs. L 2500 Å (left), Hβ-based L/L Edd (center), and EW(C IV) (right). Circles represent the low-L sources, diamonds represent the high-L sources, and triangles represent WLQs (all of which are included in the high-L subsample); the threshold between low and high luminosity is shown by the vertical dashed line in panels (a) and (d). The bold dashed lines in panels (a), (c), and (f) show the best-fit relations found in Timlin et al. (2020). Symbol sizes in panels (b) and (c) denote the EW(C IV) and L/L Edd values, respectively, with larger symbols corresponding to larger values. Our high-L sources appear to follow the α ox–L 2500 Å relation of Timlin et al. (2020); however, our low-L sources seem to spoil the relation, presumably given the selection bias inherent in the majority of these sources as explained in the text.
Other Images in This Article
Copyright and Terms & Conditions
© 2022. The Author(s). Published by the American Astronomical Society.