Image Details

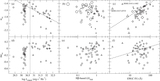
Caption: Figure 3.
The EW(C IV) vs. L/L Edd anticorrelation. For panels (a) and (b), circles represent the low-L sources (log L 2500 Å < 30.7 erg s−1 Hz−1) and diamonds represent the high-L sources. Larger symbol sizes correspond to sources with larger (i.e., less negative) α ox values in (a). In (b), symbol sizes denote the σ values of Δα ox, with the largest symbols corresponding to Δα ox values within 1σ (±0.131; e.g., Just et al. 2007). In (c), squares (pluses) represent objects with an α ox value below (above) the median value of −1.64. The dotted lines show the 10 Å EW threshold for defining WLQs (Diamond-Stanic et al. 2009), and the dashed lines show the regression lines corresponding to Equation (2) of Shemmer & Lieber (2015). It appears that the additional X-ray information does not contribute any new trends to the data.
Other Images in This Article
Copyright and Terms & Conditions
© 2022. The Author(s). Published by the American Astronomical Society.