Image Details
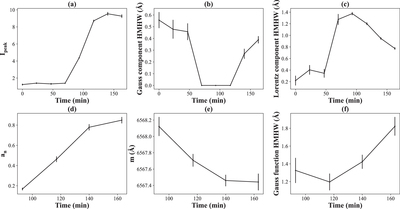
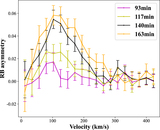
Caption: Figure 4.
Time evolution of the fitting parameters. The top rows show the total flux of the Voigt function (I 0), the HWHM of the Gaussian component (﹩\sigma \sqrt{{\rm{ln}}4}﹩), and the HWHM of the Lorentzian component (γ) in the Voigt–Gauss function, respectively. The bottom row only shows the height (a n ), the centroid (m), and the HWHM (﹩s\sqrt{{\rm{ln}}2}﹩) in the Gaussian function for the last four spectra, where profile asymmetries are observed. In each panel, the error bars represent uncertainties calculated from the fitting errors.
Other Images in This Article

Copyright and Terms & Conditions
© 2022. The Author(s). Published by the American Astronomical Society.