Image Details
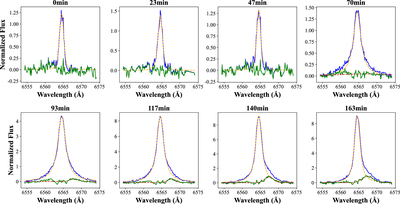
Caption: Figure 3.
Normalized Hα line profiles and their fitting results. Blue lines are the original data, orange lines are fitting results for Voigt function, red lines are fitting results for Gauss function, and green lines indicate residuals between fitting results for Voigt function and observation.
Other Images in This Article
Copyright and Terms & Conditions
© 2022. The Author(s). Published by the American Astronomical Society.
Copyright ©
2025 Astronomy Image Explorer. All Rights Reserved.