Image Details
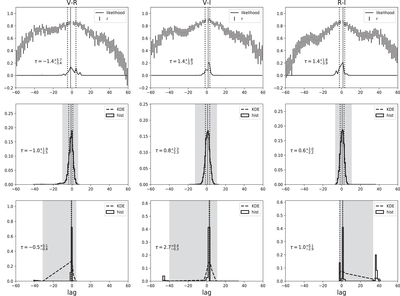
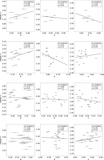
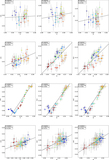
Caption: Figure 7.
Examples of lags measured with three methods on JD 2,458,745. The left, center, and right panels represent the V − R, V − I, and R − I lags, respectively. The measured lags and uncertainties are given in all panels and are indicated by the solid and dotted lines, respectively. Top panels: the discrete correlation coefficient (points) and the likelihood (curves) obtained from ZDCF and PLIKE, respectively. Bottom two rows: the CCCD and PD obtained from PyCCF and JAVELIN, respectively. The dashed lines indicate the KDE of the weighted CCCD/PD and the histograms are the unweighted CCCD/PD. The shaded regions highlight the ranges of lags included in the final calculation.
Other Images in This Article
Copyright and Terms & Conditions
© 2022. The Author(s). Published by the American Astronomical Society.