Image Details
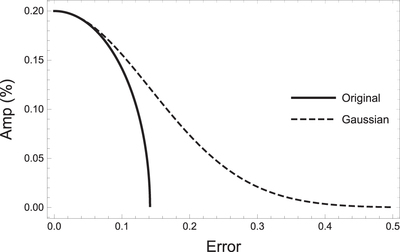
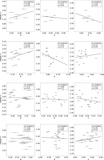
Caption: Figure 5.
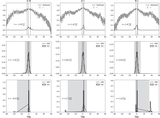
Amplitude−error diagram. ﹩{A}_{\max }-{A}_{\min }﹩ is fixed at 0.2. The dashed and solid lines represent the original method and the Gaussian modulated method, respectively.
Other Images in This Article
Copyright and Terms & Conditions
© 2022. The Author(s). Published by the American Astronomical Society.
Copyright ©
2025 Astronomy Image Explorer. All Rights Reserved.