Image Details
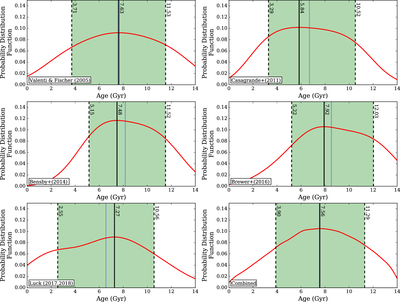
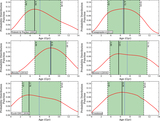
Caption: Figure 7.
Probability distribution functions for stars with M ≤ 1M ⊙, D ≤ 30 pc, and −0.52 ≤ [Fe/H] ≤ −0.28 from Valenti & Fischer (2005), Casagrande et al. (2011), Bensby et al. (2014), Brewer et al. (2016), and Luck (2017, 2018). The solid black lines indicate the maximum likelihood ages, while the dashed black lines indicate 16% and 84% probabilities. The 50% probabilities are indicated by light blue lines in all panels for comparison. The bottom right panel shows the final combined probability distribution function from which the final metallicity-based age is taken.
Other Images in This Article
Copyright and Terms & Conditions
© 2021. The American Astronomical Society. All rights reserved.
Copyright ©
2025 Astronomy Image Explorer. All Rights Reserved.