Image Details
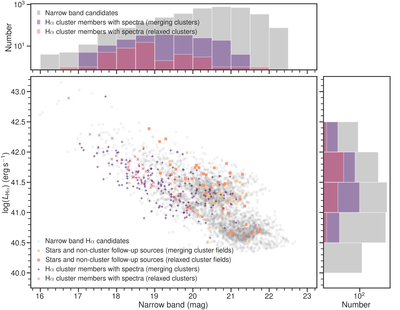
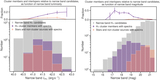
Caption: Figure 9.
The magnitude–Hα luminosity distribution of confirmed cluster Hα and non-cluster sources, compared to the underlying NB candidate pool. We note that our spectroscopy samples well the underlying population.
Other Images in This Article

Show More
Copyright and Terms & Conditions
© 2021. The American Astronomical Society. All rights reserved.
Copyright ©
2025 Astronomy Image Explorer. All Rights Reserved.