Image Details
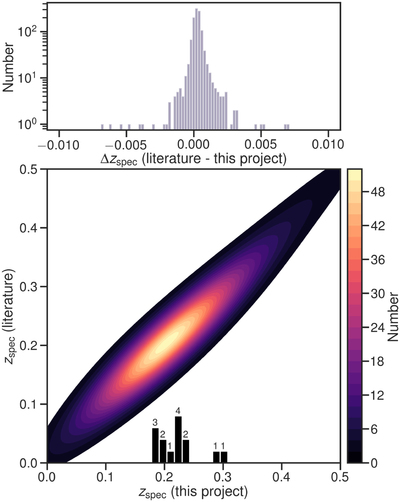
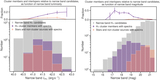
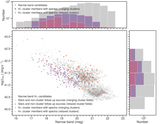
Caption: Figure 4.
The accuracy of our redshifts, compared to values from the literature. All available spectroscopy is included, not only Hα candidates. Bottom: our redshifts match well with those from the literature. Of note is the high density of sources around the cluster redshifts, whose distribution is shown in the histogram. Top: the distribution of shifts between the literature redshifts and our redshifts (note the logarithmic scale). The bulk of the sources have matching redshifts within 0.0005.
Other Images in This Article

Show More
Copyright and Terms & Conditions
© 2021. The American Astronomical Society. All rights reserved.
Copyright ©
2025 Astronomy Image Explorer. All Rights Reserved.