Image Details
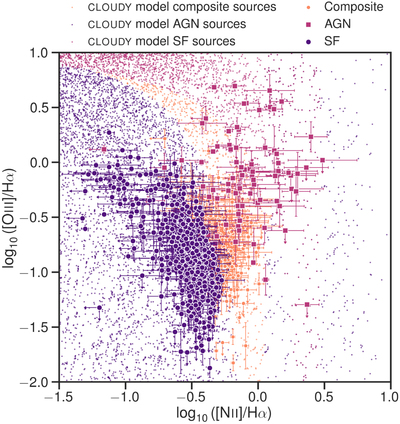
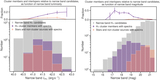
Caption: Figure 22.
Distribution of our galaxies in the [O III]/Hα vs. [N II]/Hα space, color coded by AGNs, composite, and SF emission. We show sources securely classified by using the Kauffmann et al. (2003) and Kewley et al. (2001) criteria, as well as sources classified with the help of the [O III]/Hα ratio. We show the distribution of sources from CLOUDY modeling in the background (from Sobral et al. 2018, 2019).
Other Images in This Article

Show More
Copyright and Terms & Conditions
© 2021. The American Astronomical Society. All rights reserved.
Copyright ©
2025 Astronomy Image Explorer. All Rights Reserved.