Image Details
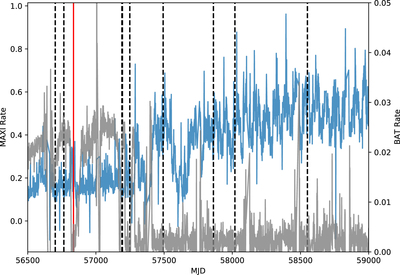
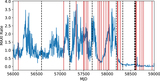
Caption: Figure 13.
Long-term 2–20 keV MAXI light curve (blue) and Swift-BAT transient monitor 15–50 keV light curve for GS 1826–24 (gray). The timing of the focused NuSTAR observation is shown by a solid red line, while the timing of the StrayCats observations is shown in dashed black lines.
Other Images in This Article
Show More
Copyright and Terms & Conditions
© 2021. The American Astronomical Society. All rights reserved.
Copyright ©
2025 Astronomy Image Explorer. All Rights Reserved.