Image Details

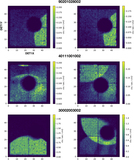
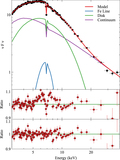
Caption: Figure 11.
Hardness–intensity diagram of the stray light observations of GX 3+1. Observation numbers refer to the sequence IDs in Table 2. Data are binned to 300 s. The banana branch is traced out by the data.
Other Images in This Article
Show More
Copyright and Terms & Conditions
© 2021. The American Astronomical Society. All rights reserved.
Copyright ©
2025 Astronomy Image Explorer. All Rights Reserved.