Image Details
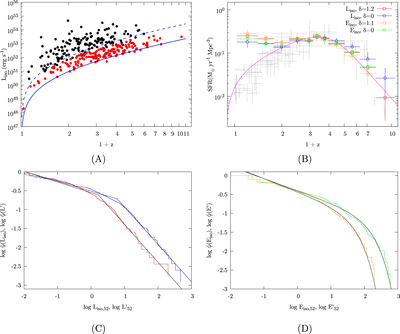
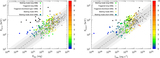
Caption: Figure 5.
Panel A: Liso vs. redshift for 315 KW GRBs. Black symbols show 171 triggered bursts (the updated T17 sample). Red symbols show the WM sample (167 bursts, this work). The observer-frame flux limits Fpeak (Section 5.3) are shown by a dashed line (triggered bursts) and a solid line (the full KW sample). Panel B: Comparison of the derived GRBFR and the SFR data from the literature. The gray points show the SFR data from Hopkins (2004), Bouwens et al. (2011), Hanish et al. (2006), and Thompson et al. (2006). The solid line denotes the SFR approximation from Li (2008). The GRBFR normalization is the same for the results derived using the four data sets and the GRBFR points have been shifted arbitrarily to match the SFR at (1 + z) ∼ 3.5. Panel C shows cumulative GRB isotropic-luminosity functions (LFs: ψ(Liso), blue; ﹩\psi ({L}^{{\prime} })﹩, red) and their BPL approximations (black). Panel D shows cumulative GRB isotropic-energy functions (EFs: ψ(Eiso), green; ﹩\psi ({E}^{{\prime} })﹩, orange) and their exponentially cut off PL approximations (black). The distributions (Section 5.3) are normalized to unity at the dimmest points. The approximation parameters are given in Table 7.
Other Images in This Article
Copyright and Terms & Conditions
© 2021. The American Astronomical Society. All rights reserved.