Image Details
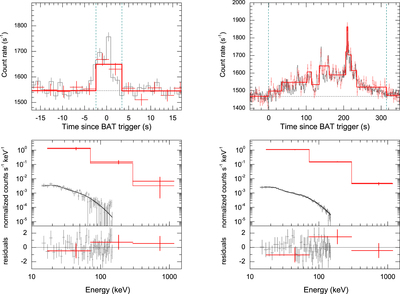
Caption: Figure 2.
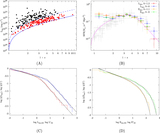
Joint KW and BAT detections of GRB 090429B at z = 9.38 (left) and GRB 110205A at z = 2.22 (right). The burst light curves are presented in the top panels. The KW waiting-mode count rates (G1 + G2, ∼20–350 keV) are shown with red points and the horizontal dashed lines indicate KW background levels. The BAT count rates (25–350 keV), arbitrary scaled to match the KW count rate and background, are shown with gray points and lines. Bayesian block divisions of the KW light curves are plotted with thick red lines. The vertical dashed lines indicate time intervals chosen for time-integrated spectral fits. Joint KW+BAT fits to the TI spectra and the fit residuals are presented lower panels, where KW and BAT spectral points are shown by red and gray points, respectively. The best-fit models (Table 2) are plotted by solid lines: the Band function, with α ≃ −0.7, β ≃ −2.3 and Ep ≃ 41 keV, for GRB 090429B; and CPL (α ≃ −1.55, Ep ≃ 220 keV) for GRB 110205A.
Other Images in This Article
Copyright and Terms & Conditions
© 2021. The American Astronomical Society. All rights reserved.