Image Details
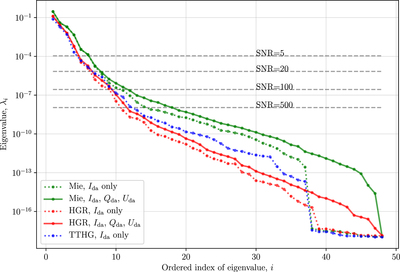
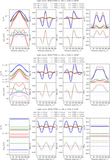
Caption: Figure 9.
The eigenvalues of the principal component of our data set of 48 lightcurves in decreasing order of the variances they represent. The green lines represent a data set generated using Mie computations, and the blue/red lines show data points computed using the TTHG/HGR approximation. Solid lines indicate the use of all three Stokes components, Ida/I0, Qa/I0, and Uda/I0, while dotted lines correspond to the use of Ida/I0 alone. The four horizontal lines show the variance due to instrumental noise expected at S/N = 5, 20, 100, and 500. The Mie data set captures a greater dimensionality than the HGR data set for all S/N levels, indicating that simulations using TTHG/HGR approximations would miss 10%–33% (for intensity only) and 14%–39% (with polarimetry) of the parametric sensitivity of lightcurve measurements.
Other Images in This Article

Copyright and Terms & Conditions
© 2021. The American Astronomical Society. All rights reserved.