Image Details
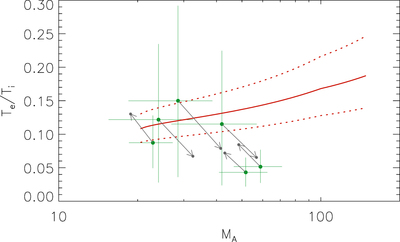
Caption: Figure 3.
Comparison of the model temperature ratio with Cassini measurements during Saturn’s bow shock crossings with ﹩{M}_{{\rm{A}}}\gt 20﹩ and ﹩{\theta }_{{B}_{n}}\gt 45^\circ ﹩ (Masters et al. 2011). Red solid line represents the heating model (Equation (16)), and red dotted lines are the error bars. Green dots are Cassini measurements, with black arrows pointing to the uncorrected values.
Other Images in This Article
Copyright and Terms & Conditions
© 2020. The American Astronomical Society. All rights reserved.
Copyright ©
2026 Astronomy Image Explorer. All Rights Reserved.