Image Details
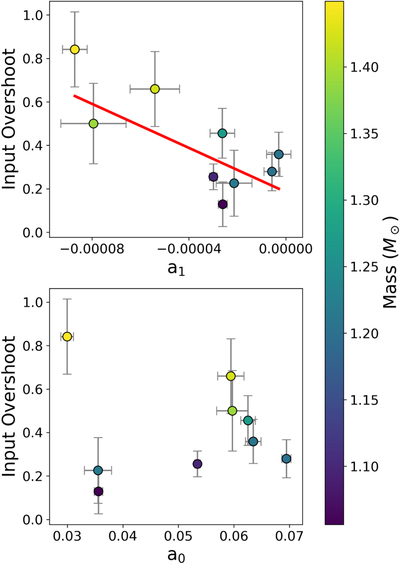
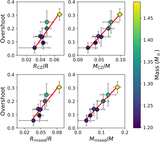
Caption: Figure 15.
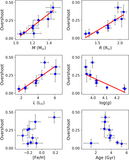
Top: Input overshoot as a function of the a1 coefficient for the sample of stars. Here, the a1 value is determined from the observed frequencies of the stars. The red line is a weighted line of best fit. Bottom: Input overshoot as a function of the a0 coefficient for the sample of stars. In both panels overshoot is in units of HP.
Other Images in This Article
Show More
Copyright and Terms & Conditions
© 2020. The American Astronomical Society. All rights reserved.
Copyright ©
2025 Astronomy Image Explorer. All Rights Reserved.