Image Details
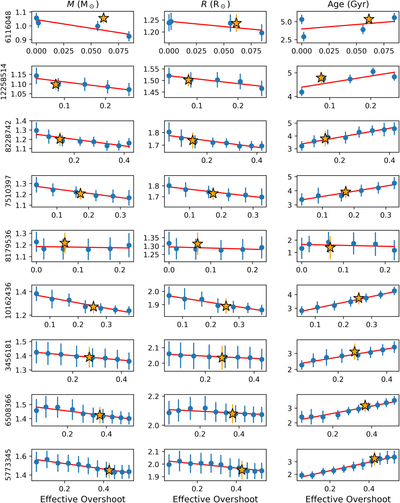
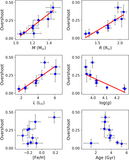
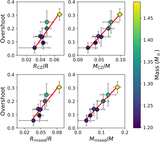
Caption: Figure 6.
Inferred values of various stellar properties for each of the overshoot subgrids for each star. Column 1 shows the mass, Column 2 the radius, and Column 3 the age. The various rows, labeled by KIC number, are the different stars in the study. The orange star symbol in each panel is the inferred value for all subgrids combined. The red line is a line of best fit to help guide the eye. Overshoot is in units of HP.
Other Images in This Article
Show More
Copyright and Terms & Conditions
© 2020. The American Astronomical Society. All rights reserved.
Copyright ©
2025 Astronomy Image Explorer. All Rights Reserved.