Image Details
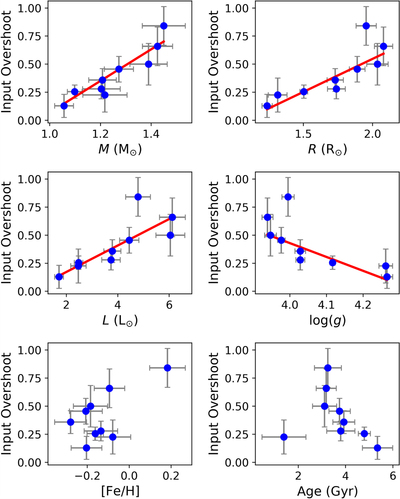
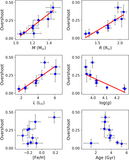
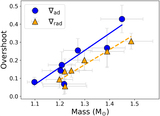
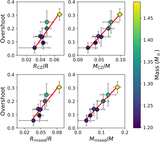
Caption: Figure 14.
Likelihood weighted average of the input overshoot value (in units of HP) plotted as a function of a variety of stellar properties for the stars in the study. The red line is a weighted linear best fit.
Other Images in This Article
Show More
Copyright and Terms & Conditions
© 2020. The American Astronomical Society. All rights reserved.
Copyright ©
2025 Astronomy Image Explorer. All Rights Reserved.