Image Details
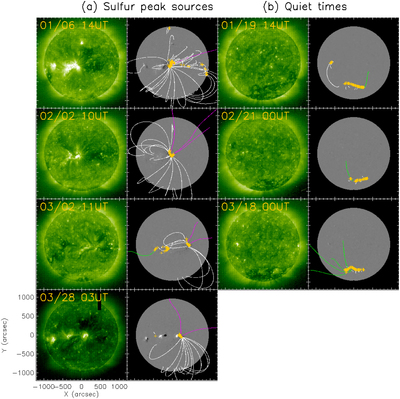
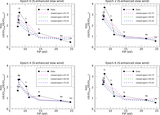
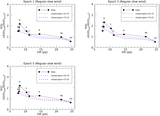
Caption: Figure 3.
Field lines identified at the footpoint locations (orange crosses on the magnetograms) of the sulfur-enhanced slow wind (a) and of the regular slow wind (b), marked by the red and blue vertical lines in Figure 1, respectively, with corresponding EIT 195 Å images. The white, magenta, and green field lines indicate the closed, negative open, and positive open-field lines, respectively. The average magnetic field profiles of open-field lines (only negative/magenta for (a)) were used for the modeling in Section 3.
Other Images in This Article
Copyright and Terms & Conditions
© 2020. The American Astronomical Society. All rights reserved.
Copyright ©
2025 Astronomy Image Explorer. All Rights Reserved.