Image Details
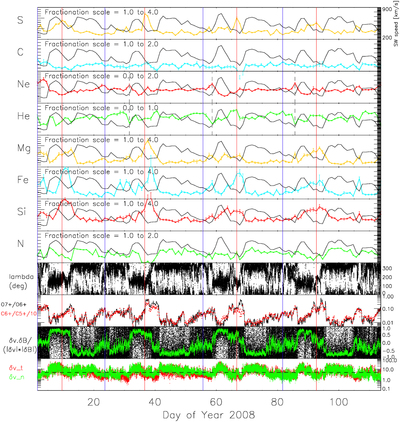
Caption: Figure 1.
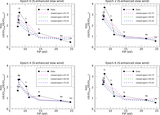
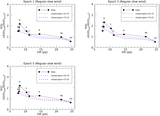
Top eight panels: the daily solar wind speed (black) vs. fractionation values of various elements (colors) from 2008 January 1 to 2008 April 22. Repeated sulfur enhancement within a certain wind speed pattern, as well as interesting correspondences among various elements (see Section 2 for detail), can be seen. Bottom four panels: the orientation of IMF fields (∼135° and ∼315° correspond to the inward and outward direction with respect to the nominal Parker spiral, respectively, 64 s average), O+7/O+6 (black) and C+6/C+5/10 (red) charge state ratios (2 hr average), the quantity ﹩(\delta v\cdot \delta B)/| \delta v| | \delta B| ﹩, which is a proxy of Alfvénicity (black for 64 s average and green for their 1 hr average), and the velocity fluctuations in normal (green) and tangential (red) direction (64 s average). The red and blue vertical lines mark the two kinds of slow wind that repeatedly appear during this period, one with sulfur enhancement and the other without sulfur enhancement, respectively.
Other Images in This Article
Copyright and Terms & Conditions
© 2020. The American Astronomical Society. All rights reserved.