Image Details
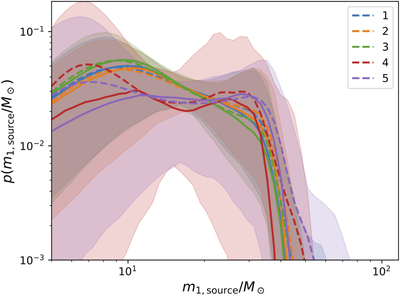
Caption: Figure 12.
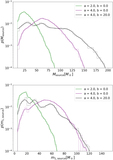
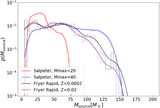
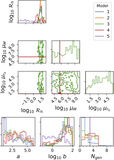
Inferred ﹩{m}_{1,\mathrm{source}}﹩ distributions for Models 1–5. Shown are the median (solid line), posterior predictive (dashed line), and 90% credible intervals (shaded region).
Other Images in This Article
Show More
Copyright and Terms & Conditions
© 2020. The American Astronomical Society. All rights reserved.
Copyright ©
2025 Astronomy Image Explorer. All Rights Reserved.