Image Details
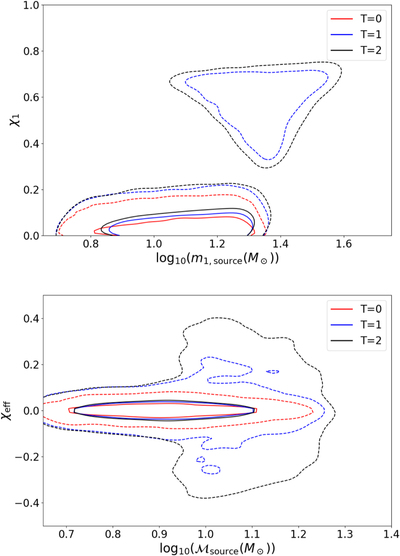
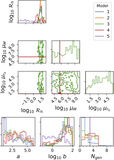
Caption: Figure 3.
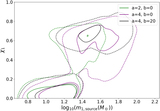
Joint mass–spin distributions for three successive time steps. Top: the spin amplitudes of the more massive merger component vs. their masses. Bottom: the effective spin parameter χeff vs. the binary chirp mass. The contours represent 90% and 99.9% contour intervals for mergers at time steps T = 0 (red), T = 1 (blue), and T = 2 (black).
Other Images in This Article
Show More
Copyright and Terms & Conditions
© 2020. The American Astronomical Society. All rights reserved.
Copyright ©
2025 Astronomy Image Explorer. All Rights Reserved.