Image Details
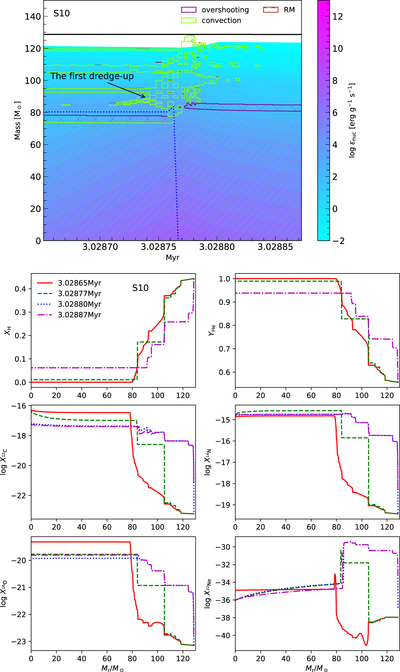
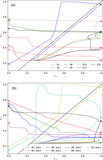
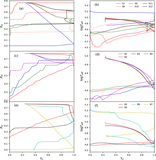
Caption: Figure 14.
Top panel: Kippenhahn diagram for model S10. Green hatched regions are convective, and purple hatched regions are overshooting. Pink shaded regions indicate the energy generation for hydrogen burning. Bottom panel: variation of profiles for various chemical elements with evolutionary age in model S10.
Other Images in This Article
Show More
Copyright and Terms & Conditions
© 2020. The American Astronomical Society. All rights reserved.
Copyright ©
2026 Astronomy Image Explorer. All Rights Reserved.