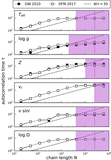
Image Details
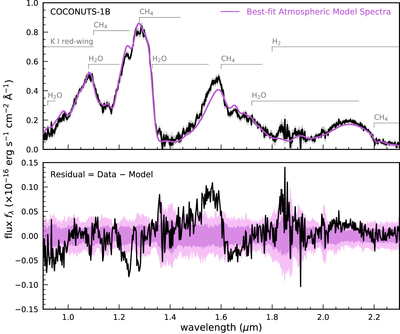
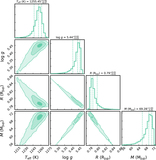
Caption: Figure 9.
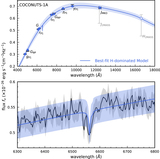
The upper panel presents the observed spectra of COCONUTS-1B (black) with 1σ measurement uncertainties (gray shadow) and the Sonora atmospheric model spectra interpolated at the parameters drawn from the MCMC chains (purple). The lower panel shows the fitting residual (data–model; black), and the purple shadows are the 1σ and 2σ dispersions of 50,000 random draws from the covariance matrix, composed of measurement uncertainties along the diagonal axis.
Other Images in This Article
Show More
Copyright and Terms & Conditions
© 2020. The American Astronomical Society. All rights reserved.
Copyright ©
2024 Astronomy Image Explorer. All Rights Reserved.