Image Details
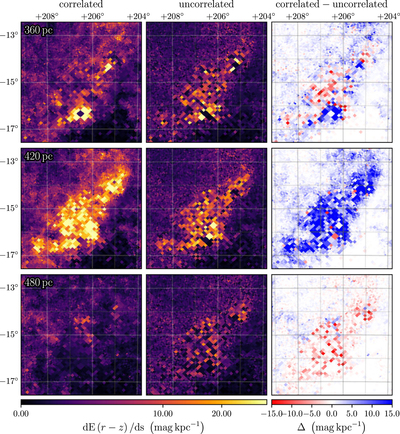
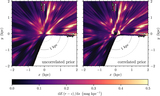
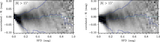
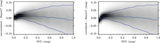
Caption: Figure 8.
Reddening density in the vicinity of Orion B. Each row corresponds to a different distance. The left column shows the results from the final iteration, with a correlation length of 1.5 pc. The center column shows the results from the initial, uncorrelated iteration, while the right column shows the difference between the final and initial iterations. Dust clouds have fewer “holes” when the correlated prior is applied, and are better localized in distance. Note that in the correlated iteration, we localize the distance of Orion B much more precisely, while in the uncorrelated iteration, it is smeared across a greater range of distances.
Other Images in This Article

Show More
Copyright and Terms & Conditions
© 2019. The American Astronomical Society. All rights reserved.