Image Details
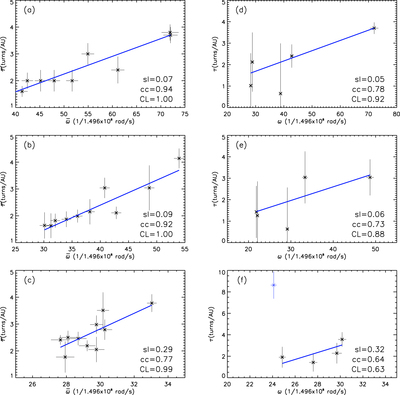
Caption: Figure 2.
Average twist vs. average plasma poloidal angle velocity in a peeled flux rope (panels (a)–(c)) and the twist vs. plasma poloidal angular velocity in the flux rope layer (panels (d)–(f)) for the MC, in which the blue lines indicate the linear fitting results. sl, cc, and CL are the slope of linear fitting, the correlation coefficients, and the confidence level by a permutation test, respectively. Panels (b) and (e) show the test results for adding 5% average randomized noise, and panels (c) and (f) show the test results for changing the orientation of the MC axis to the mean value of the 10 orientations (see more details in Zhao et al. 2018).
Other Images in This Article
Copyright and Terms & Conditions
© 2019. The American Astronomical Society. All rights reserved.