Image Details
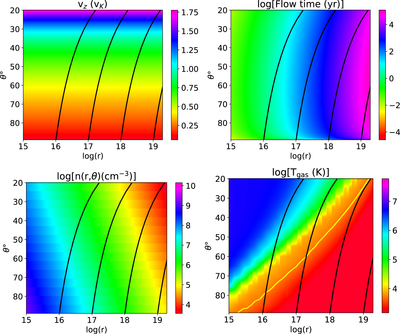
Caption: Figure 3.
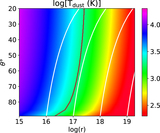
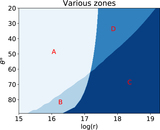
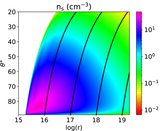
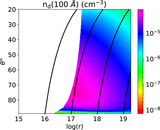
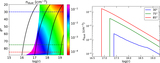
Color map of physical quantities in polar (﹩r,\theta ﹩) coordinates. The lines (in black) on the figure represent the parabolic flow lines with various starting/launch radii on the accretion disk, r0. The accretion disk is located along the θ = 90° plane, i.e., the lower horizontal axis of the figures. Top left: gas velocities in the z-direction in terms of the Keplerian velocities (VK) are presented (Equation (5)). Top right: the time (in years) taken by the gas to reach a given distance on the r-θ plane is presented (Equation (6)). Bottom left: the distribution of gas density n(r, θ) in polar coordinates is presented, assuming solar composition of the gas. Bottom right: the color map shows the gas temperature in polar (r, θ) coordinates, assuming solar composition of the gas. The yellow line demarcates the region lower than 4000 K, in the r, θ plane, where formation of molecular clusters and seeds is supported. Importantly, however, the formation of dust grains from these seeds happens only when the temperature is lower than 2000 K.
Other Images in This Article
Show More
Copyright and Terms & Conditions
© 2019. The American Astronomical Society. All rights reserved.