Image Details
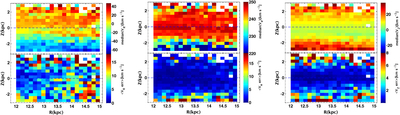
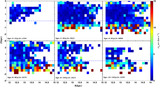
Caption: Figure 2.
Edge-on views of the kinematics of the disk derived using the RC giant sample. From left to right, bins show the median velocity VR, Vθ, VZ (in km s−1) of RC stars within each bin on the R, Z plane. The red color is prominent in the north corresponding to the blue/cyan color in the south, the asymmetric region corresponding to the South-middle and South-middle opposite density structures is evident in the radial and rotational velocity distributions. The right panel shows vertical velocity distribution in the R, Z plane, the range is R = [12 15], kpc, Z = [−3 3] kpc, the green/red colors predominate bins both above and below the plane, illustrating that there is a clear bulk motions at all radii.
Other Images in This Article

Copyright and Terms & Conditions
© 2019. The American Astronomical Society. All rights reserved.