Image Details
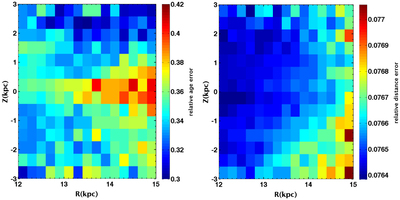
Caption: Figure 1.
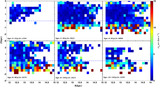
Left and right panels show the distribution in the R–Z plane of projected relative age and distance errors, respectively. The color bars indicate the relative age errors (left) and relative distance errors (right). The blue/cyan colors dominate the pattern implying that most of the relative age error is less than 38% and most of the relative distance error is less than 8%.
Other Images in This Article

Copyright and Terms & Conditions
© 2019. The American Astronomical Society. All rights reserved.
Copyright ©
2025 Astronomy Image Explorer. All Rights Reserved.