Image Details
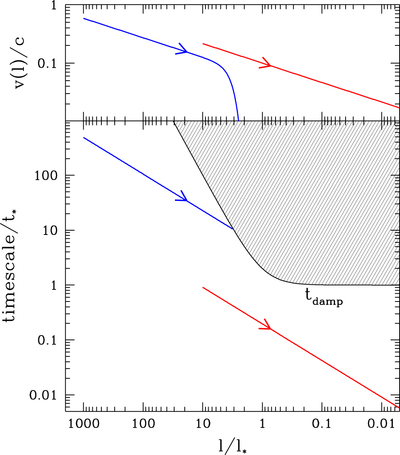
Caption: Figure 2.
Upper panel: turbulence cascade spectrum v(ℓ) in the presence of Compton damping. The blue curve shows the cascade in a jet with optical depth ﹩\tau ={{\ell }}_{0}/{{\ell }}_{\star }={10}^{3}﹩ and the heating parameter ξ = 0.2; it has a viscous cutoff at ﹩{{\ell }}_{\mathrm{damp}}\gt {{\ell }}_{\star }﹩. The red curve shows a similar cascade when τ = 10 and ξ = 0.01; it does not cut off and extends to microscopic plasma scales ﹩{\ell }\ll {{\ell }}_{\star }﹩. In both cases, the jet has enthalpy w ≈ 2ξ (see the text). Bottom panel: comparison of the cascade timescale tturb(ℓ) = ℓ/v(ℓ) (the blue and red curves show the same models as in the upper panel) with the Compton damping timescale ﹩{t}_{\mathrm{damp}}({\ell })﹩ (black curve). Compton damping prevents the cascade from entering the shaded region where ﹩{t}_{\mathrm{turb}}\gt {t}_{\mathrm{damp}}﹩.
Other Images in This Article

Copyright and Terms & Conditions
© 2019. The American Astronomical Society. All rights reserved.