Image Details
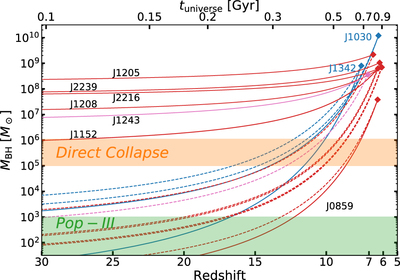
Caption: Figure 10.
Estimated growth history of the z ≥ 6.1 HSC quasars. The x-axis is given in both redshift (bottom) and time since the Big Bang (top). Solid lines show the case where SMBHs grow at the observed Eddington ratio at all times, while dashed lines show the case where SMBHs grow at the Eddington limit Lbol/LEdd = 1. The six HSC quasars in this work are shown in red, while HSC J1243+0100 is shown in magenta. The observed masses are shown as filled diamonds. For comparison, two luminous z > 6 quasars are also shown in blue: J1342+0928 at z = 7.54 from Bañados et al. (2018) and J0100+2802 at z = 6.33 from Wu et al. (2015). The shaded regions correspond to the mass ranges of Pop III remnant BHs (Mseed ≲ 103 M⊙; green) and direct collapse BHs (Mseed ∼ 105–6 M⊙; orange).
Other Images in This Article


Copyright and Terms & Conditions
© 2019. The American Astronomical Society. All rights reserved.