Image Details
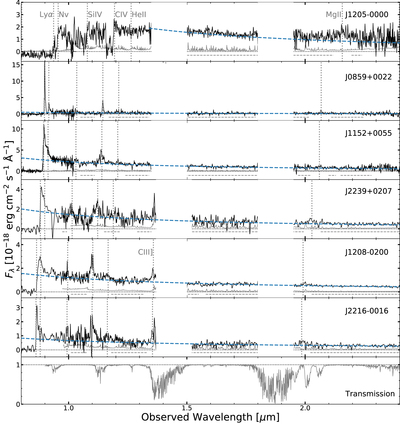
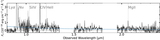
Caption: Figure 1.
Optical-to-NIR spectra of the six HSC quasars in this paper. The top three panels show the X-Shooter spectra of J1205−0000, J0859+0022, and J1152+0059. The next three show the GNIRS spectra of J2239+0207, J1208−0200, and J2216−0016, while their optical data (λobs ≲ 1 μm) are from the discovery spectra (Matsuoka et al. 2016, 2018b). The bottom panel shows the atmospheric transmission at Maunakea retrieved from the Gemini Observatory (Lord 1992). The vertical lines indicate the central wavelength of broad emission lines expected from the systemic redshift (Mg II redshift for J1205−0000 and [C II] redshift from Izumi et al. 2018, 2019 for the others). In each panel, the noise spectra are shown in gray, and the best-fit power-law continuum models are shown in blue.
Other Images in This Article


Copyright and Terms & Conditions
© 2019. The American Astronomical Society. All rights reserved.